Exchequer receipt roll: Overview of Payments
As mentioned in other posts, namely ‘Digital Humanities meets Medieval Financial Records’ and ‘Exchequer receipt roll: from transcript to spreadsheet’, I am working on data derived from the 1301–2 receipt roll of the Irish Exchequer Receipt via a project funded by the Jean Golding Institute.
Using Python and pandas, it was possible to easily explore the data and visualise it with plots via the Matpotlib and Seaborn visualisation libraries.
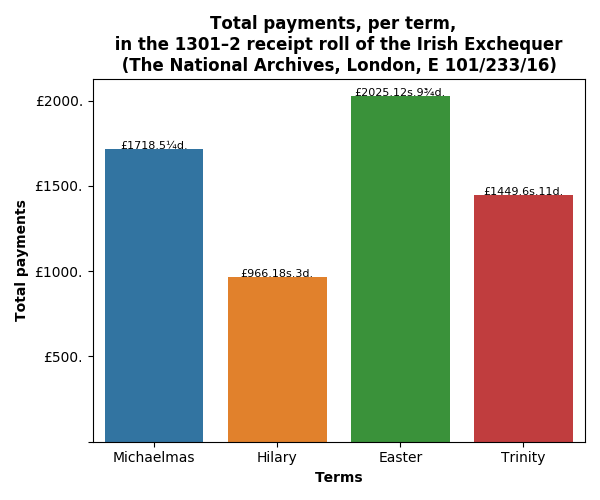
The total value of the receipts for the financial year was £6159.18s.5d. This total is one penny more than that recorded by the exchequer clerk, who missed some fractions of a penny recorded in the 24 May 1302.
Of the payments:
- the smallest payment was 8 pence
- the largest payment was £310
- the median payment was £1.10s.2d.
- the mean payment is £7.1s.1d.
- the mode payment was 6s.8d.
The financial year was broken into four terms: Michaelmas (September–December), Hilary (January–March), Easter (April–June) and Trinity (June–August). Using these terms, we can break down the value of receipts by these terms.
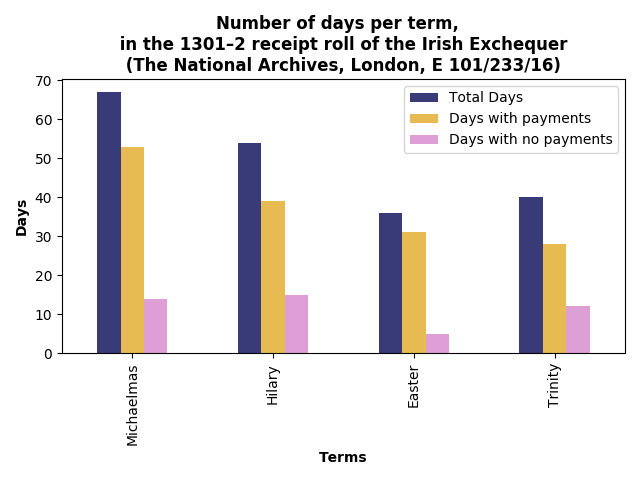
The terms themselves were not of an equal length of time. Also, within each term, there are various days the exchequer did not sit, or no payments were received.
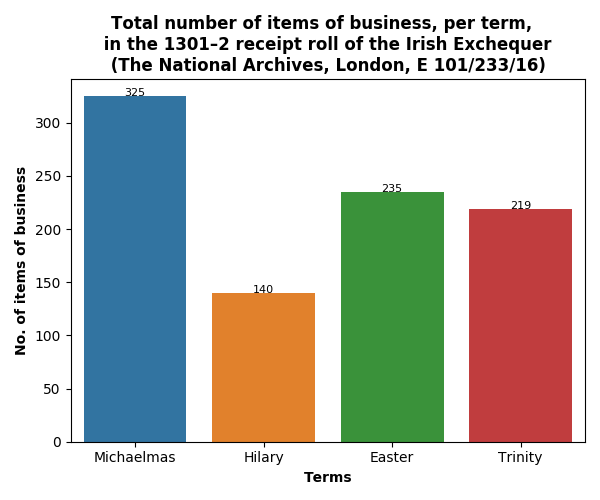
Within each term, the amount of business, i.e. the number of receipts received in the exchequer, also varies.
We can plot all three variables – total revenue, length of the term and amount of business – in a radar plot with each variable represented as a percentage of the total value for the year.
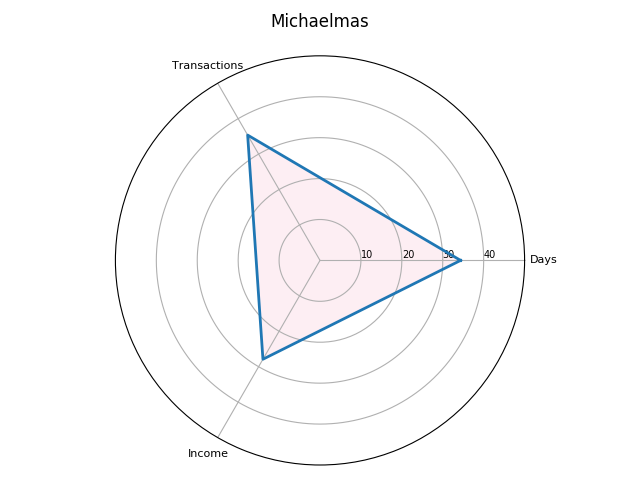
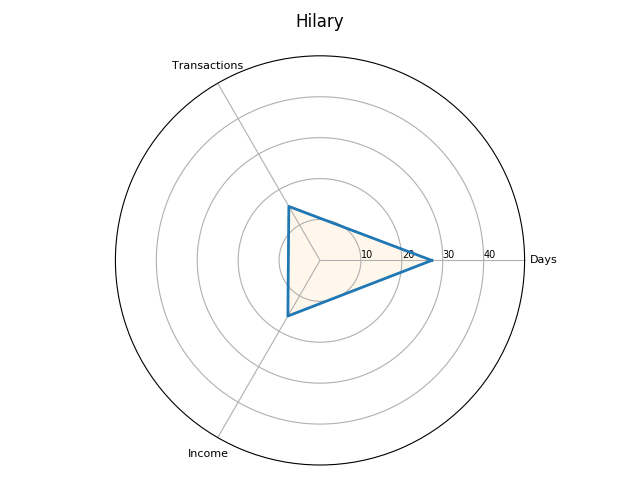
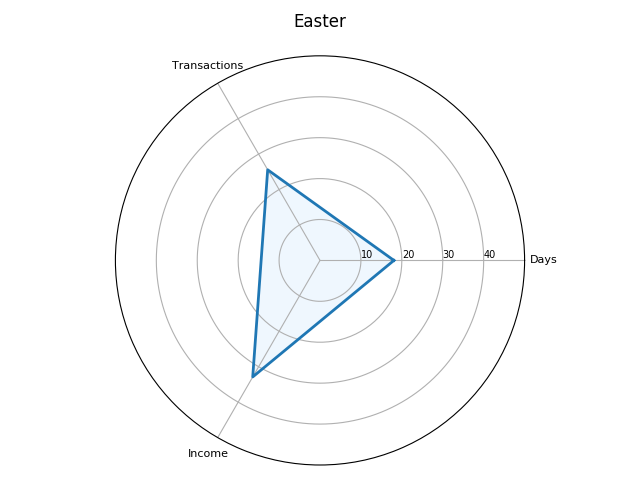
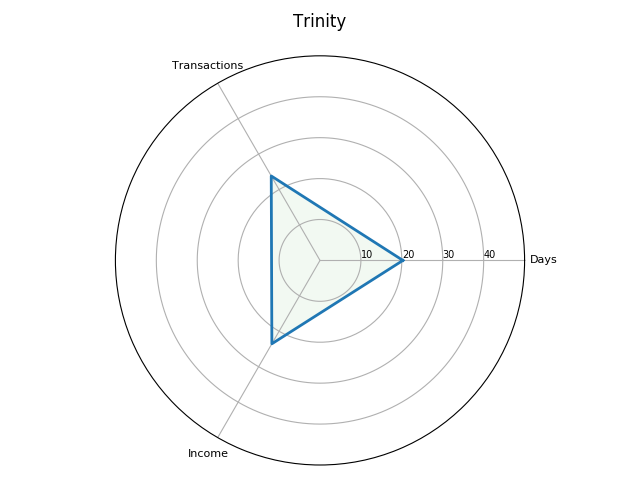
What is immediately striking in these plots is that the Hilary term is relatively long but has the least business and income, whereas the Easter term is quite short but provides the most income.
Clearly this is only a window on a specific year, and it would be interesting to see trends over time. How does the 1301/2 financial year compare to others with Edward I’s reign? What trends can be seen over the years, decades and centuries? How was the income from Ireland affected by war, rebellion, famine and plague? Are there trends to be gleamed from the different administrations under varying chancellors? Also, does income reflect the changeable effectiveness of English royal authority in Ireland?
In future posts, I’ll be digging further into the data.